ANALYTICS DASHBOARD
Energy analytics that drive opportunities
Discover how you can reduce your energy footprint and uncover cost savings with our easy-to-use web-based dashboard.


ANALYTICS DASHBOARD
Discover how you can reduce your energy footprint and uncover cost savings with our easy-to-use web-based dashboard.
An easy way to Find, Track & Prove energy savings
A data dump of kilowatts and therms per hour may be great for engineers, but most business decision-makers need simple, concrete, business-oriented data to help them understand the value of managing energy to drive better building performance.

EnergyPrint’s Utility Dashboard gives you centralized access to your building portfolio’s energy analytics — and those of similar buildings — for you to explore and answer key business questions using metrics in real dollars and cents.
TRY DEMO"EnergyPrint makes it easy for us to see exactly where we should invest in building improvements. Less costly utility bills improve the value of our buildings and go a long way toward keeping our tenants happy."
- David Bergstrom, COO
Wellington Management
HOW IT WORKS
We start the process by working directly with utility providers to collect, aggregate, input and validate 24 months of utility data for your buildings. Then, our expert team of data professionals helps you establish and better understand energy benchmarks, identify trends and generate powerful, actionable business insights that answer these four questions about your buildings:
How are your buildings doing?
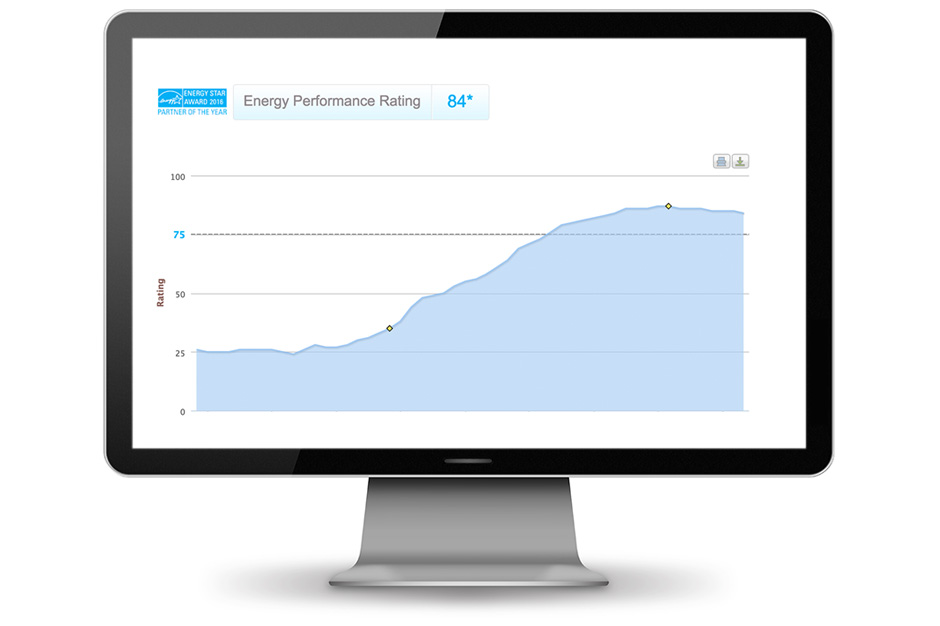
We take away the guesswork of assessing building performance using current, relevant and accurate building performance metrics. Benchmark a building against itself, its peers and ENERGY STAR Portfolio Manager® using our proprietary database of building utility data.
Are buildings getting better or worse?
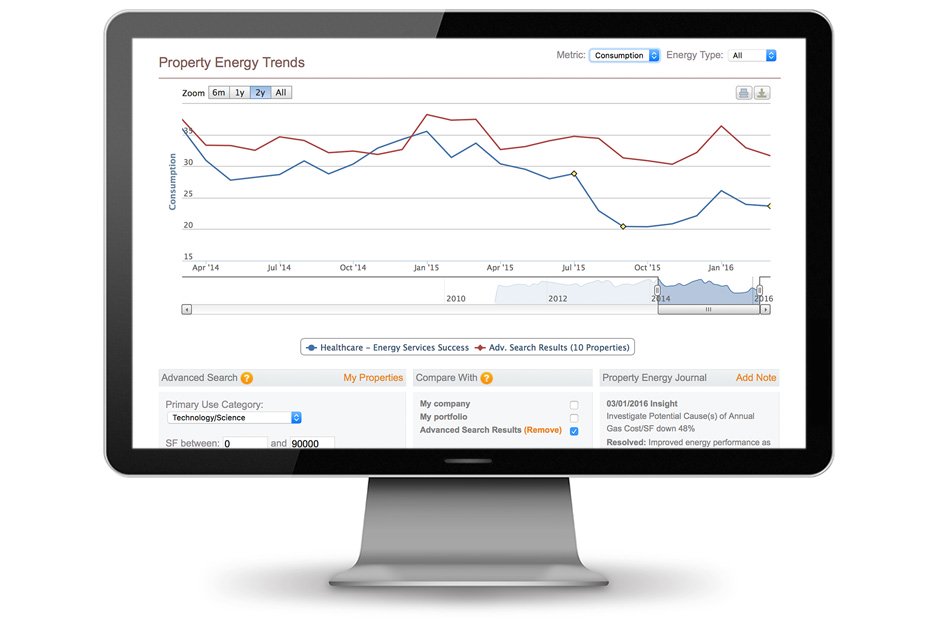
Prioritize where to focus attention by tracking how your energy use and expense changes over time, varies with weather patterns and responds to operations and equipment modifications. Quickly sort your properties to highlight your best performers and your greatest areas of opportunity.

Where are the best opportunities for savings?
Drill into specific properties for deeper energy performance intelligence so you can implement solutions that truly change building performance and reverse negative trends. Create benchmarks based on regions, property type, square footage and more.
Have past improvements paid off?
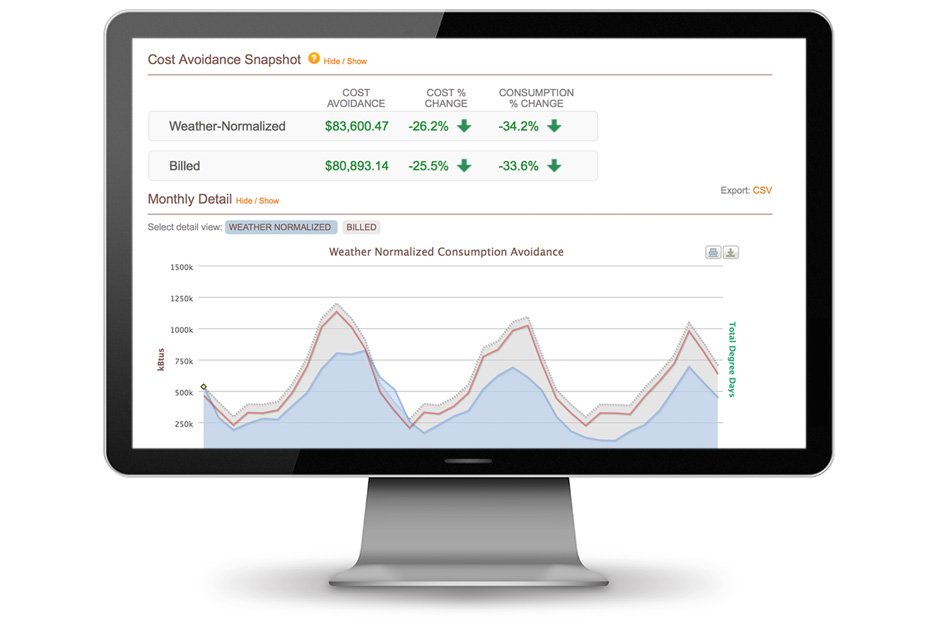
Know the impact of every investment, large or small, and leverage utility data to find even more ways to improve. By setting a baseline, you can track both billed and weather normalized energy performance for your M&V reporting needs.
What good are energy analytics if they don’t translate to action? Here are just a few examples of insights you can use to improve buildings’ energy use with EnergyPrint’s Utility Dashboard.

Find opportunities
Summarize cost, consumption and carbon use across your portfolio. Compare against peers by region, property type, square footage and more to discover which buildings have the best savings opportunities.
Track building performance
Identify trends and generate actionable insight as data is collected, validated and input each month. Monitor changes related to building improvements, operating changes and equipment defects.

Prove financial results
EnergyPrint's Cost Avoidance reporting visualizes energy savings based on an adjustable 12-month baseline period. When degree-day correlation is strong, Cost Avoidance will be adjusted for weather.
OUR SOLUTIONS
See how you can improve building value and performance with relevant and accurate data, benchmarking and reporting services from EnergyPrint.
Gain insights with relevant, accurate utility data
Learn MoreDiscover opportunities to reduce and manage energy costs
Learn More
Tell your energy savings story with Insights Architect
Learn More
Identify leads and opportunities and become a trusted energy advisor
Learn More
Establish credibility with data-driven benchmarking reports
Learn More
Prove energy savings and ROI with quality utility data
Learn More
Get utility data delivered to you any way you want it
Learn MoreStreamline the ENERGY STAR certification process
Learn More